
Case study
Safety Level Reporting — Radon
From a kitchen-tablet indicator to three-location radon trends and contextual announcements, with seasonal analytics that keep data coverage visible.
Maturity: Implemented
Problem
The idea began with an observation about reporting: a household sensor can offer a clearer route from measurement to action than a business dashboard. A number alone leaves the reader to decide whether it matters, whether it is changing, and what they can do about it.
Radon makes that reporting problem concrete. A current reading, a rolling average, and the practicality of opening a window answer different questions. The longer-term question is whether seasonal evidence supports investing in active radon mitigation.
Constraints
- Distinguish the latest reading from the reported 30-day average.
- Keep display bands, announcement rules, and analysis thresholds explicit.
- Preserve missing data as missing; an offline sensor must not appear as zero.
- Weather and window status affect an operational suggestion. They do not establish that ventilation is an effective mitigation method.
- Publish only the owner’s explicitly approved dashboard captures. Other household readings and announcement history remain private.
Architecture
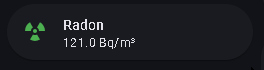
The kitchen tablet condenses radon into a single worst-level summary with green, orange, and red attention states. Tapping the indicator opens a dedicated detail subview. Its radiation icon makes the radon indicator recognizable without opening a chart; the color describes the configured display band, rather than establishing that a reading is risk-free.
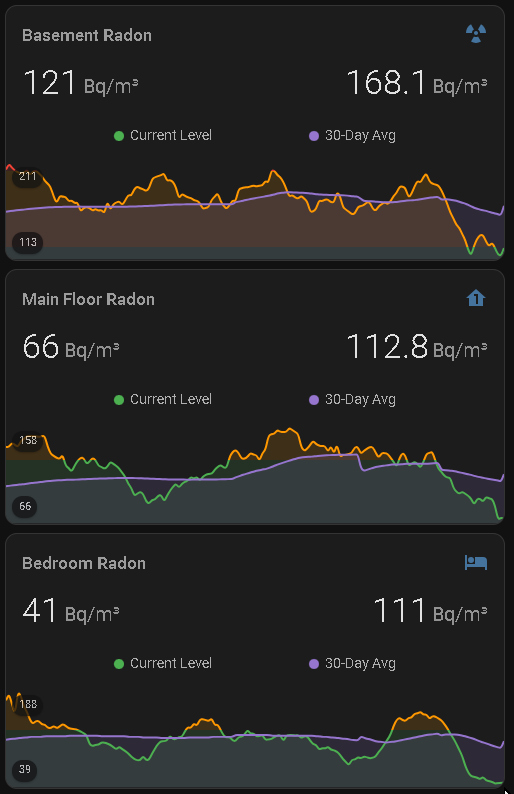
The location charts use a radiation icon for Basement, a house with a 1 for Main Floor, and a bed for Bedroom. The Operations Information System view provides three-location reporting: an identifying icon, the current reading, a reported 30-day average, and colored trend charts. The charts show recent history of both series; a 30-day average does not mean the chart itself displays 30 days.
Recreated architecture illustration
The analytics path uses a separate long-term PostgreSQL / TimescaleDB feed alongside the Home Assistant recorder. Evidence.dev is the reporting layer for historical analysis, rather than the source of the live tablet readings.
AI and agent workflow
Hourly Holla combines operational context into a spoken update. Its radon context includes current readings, outdoor conditions, and monitored windows. The intended branches are an opening-window suggestion when conditions permit, an indoor-ventilation suggestion when they do not, and silence or a bounded status message below the advisory threshold.
How the AI speaks: the automation settles the advisory code first. Google
Gemini then phrases the announcement from that code and the readings behind
it, and may not change the recommendation. Home Assistant Cloud’s voice turns
the text into speech on the house speakers.
The sample below shows the result for an OPEN_WINDOWS hour.
OPEN_WINDOWS announcement written for this page and rendered by the house's Home Assistant Cloud voice. It is not a recording of a real announcement. Transcript: "Radon update. The basement is reading one hundred and thirty-two becquerels per cubic metre, above the advisory level of one hundred. It's fourteen degrees and partly cloudy outside, and all monitored windows are closed, so now is a good time to open a window for a while."
OPEN_WINDOWS permits an opening-window suggestion. Suitable weather means above 5 °C and at most 25 °C, sunny, partly cloudy or cloudy, with the sun above the horizon.The implementation review found and corrected a conflict between the weather-aware summary and the AI instruction. A compact audit now records the requested recommendation after the announcement script returns. That record does not establish the AI’s exact words, successful audio delivery, or that somebody heard it or acted because of it.
The following excerpts were checked against the deployed configuration. They show the actual branch order, prompt constraints, and audit handoff. Sensor collection and unrelated announcement topics are omitted; these are excerpts, not a complete automation.
variables:
  radon_context: >-
    {% if ns.levels | count != 3 %}{% set decision = 'CHECK_SENSORS' %}
    {% elif ns.levels | max <= 100 %}{% set decision = 'QUIET' %}
    {% elif ns.valid_windows != 4 %}{% set decision = 'CHECK_WINDOWS' %}
    {% elif ns.open_windows > 0 %}{% set decision = 'WINDOWS_ALREADY_OPEN' %}
    {% elif weather_ok %}{% set decision = 'OPEN_WINDOWS' %}
    {% else %}{% set decision = 'INDOOR_VENTILATION' %}{% endif %}
The context is collected before generation: weather_ok combines the checked
outdoor conditions, while the window counts preserve unavailable inputs. The
greater-than-100 current-reading advisory rule is separate from the
150+ long-term monitoring metric used in analytics.
The AI task receives an explicit constraint instead of treating every elevated reading as a reason to open windows:
instructions: >-
  Follow the Radon Summary's explicit advisory code and its requested branch exactly.
  OPEN_WINDOWS is the only code that permits a suggestion to open windows.
  INDOOR_VENTILATION must never become an opening-window suggestion.
After the existing announcement script returns, the automation writes its requested branch and timestamps to a bounded helper. A template sensor mirrors that record into the existing long-term archive:
- alias: Audit radon advice after announcement script returns
  action: input_text.set_value
  target:
    entity_id: input_text.radon_advisory_audit
  data:
    value: >-
      v1|{{ utcnow().isoformat() }}|{{ radon_context.decision }}|script_returned|{{ radon_context.at }}
  continue_on_error: true
The audit makes future response analysis possible. It records a policy request and a completed script call; it does not prove what was heard or why a window subsequently opened.
Human governance
The household decides whether to act and whether to pursue professional mitigation. Suggestions do not operate windows automatically.
The proposed 150 Bq/m³ analysis threshold is an owner-selected monitoring threshold. It is distinct from Canada’s 200 Bq/m³ radon guideline and is not a claim that readings below it are risk-free. Health Canada’s guidance calls for long-term measurement when assessing mitigation; a rolling 30-day indicator does not replace that assessment.
See Health Canada’s home measurement guidance.
Evidence
The two series can be inspected independently:
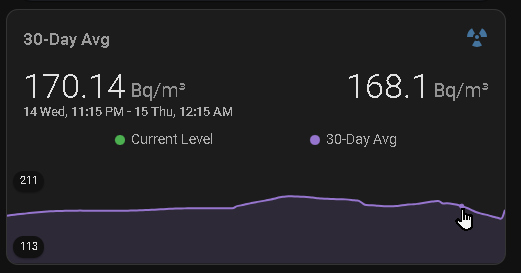
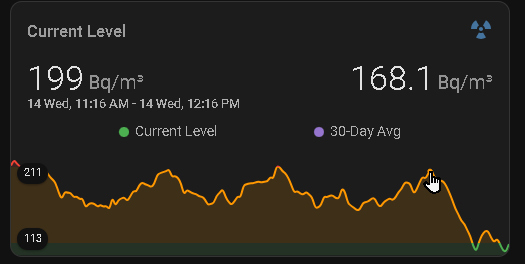
These owner-supplied captures demonstrate the interface. The displayed “30-Day Avg” is the Home Assistant helper’s reported sample mean; its available history can be shorter after a restart. The separate analytics report uses an archive-derived average with explicit coverage requirements.
The analytics work separates three questions:
- Persistence: on how many completed days did each location’s archive-derived 30-day average meet or exceed the monitoring threshold? One daily observation avoids counting every sensor update as a separate event.
- Response: after a recorded opening-window recommendation, how many monitored windows changed from closed to open within a defined interval? Already-open windows, incomplete follow-up, and unavailable inputs need separate treatment.
- Seasonality: how do results differ by month and by practical ventilation opportunity? A spring or summer label alone does not establish suitable weather.
The analytics mean is calculated from long-term sensor history, weighted by time, with explicit limits on gaps and minimum coverage. It is kept distinct from the dashboard helpers’ reported sample means, which can rebuild from a shorter history after a restart despite their configured 30-day window.
Coverage and freshness belong beside the results. Overlapping rolling averages are not independent exposures, and a post-announcement opening is an association, not proof that the announcement caused it.
Outcome
The tablet indicator, location reporting, and announcement workflow exist. The private Evidence.dev report has been implemented and its queries validated. Prospective response measurement is instrumented; historical announcements cannot be reconstructed from the sensor archive. No mitigation verdict, quantified improvement, or completed winter comparison is claimed here. The immediate objective is to establish measurement before winter limits window ventilation.
Lessons
A reporting system needs more than charts. It needs defined metrics, visible uncertainty, a practical response, and a way to evaluate what happened next. The same questions apply to business operations: what requires attention, what action is feasible, and what evidence would change the next decision?